The Databricks Debugger
Do you know that feeling, when you write beautiful code and everything just works perfectly on the first try?
I don’t.
Every time I write code It doesn’t work in the beginning, and I have to debug it, make changes, test it…
Databricks introduced a debugger you can use on a code cell, and I’ve wanted to try it for quite some time now. Well, I guess the time is now 🙂 .
Prerequisites
Before we start, note some prerequisites:
- This feature is still in public preview
- It only works on Python cells
- You need Databricks Runtime version 13.3 LTS or above
- Cluster access mode must be Single-user or No isolation shared
If the debugger is not enabled by default, you might need to enable it. Go to settings (by clicking on the user icon at the top-right corner) and then developer. look for “Python Notebook Interactive Debugger” and make sure it’s on.

Simple debug use
Now let’s create a new notebook. Make sure the notebook’s default language is Python, and create a code cell.
Let’s try a really simple (and silly) example:
list = [1,2,3,0,9]
for i in list:
  print(9/i)
Oh no! My code failed! but why? Which of the objects in the list caused the divide-by-zero error?
To use the debugger, click the dropdown icon on the cell top-left corner, and choose “Debug cell” or use the keyboard shortcut Alt+ Shift + D .

Let’s add a breakpoint on the third line (the print inside the for loop) by clicking on the left side (a red dot will appear). A breakpoint means the program will stop running at this point and let us examine the situation (variables, errors so far).

By clicking on the arrow button on the debug toolbar, we can run the code from breakpoint to breakpoint. On the third iteration, we will see this:

And on the left side, the variables pane with the current variable value:

We got to the error, and we can see on the variables pane on the right side that the value of i in this iteration is 0.
Amazing! The divide-by-zero error was caused by the value zero! 🙂
Debug functions use
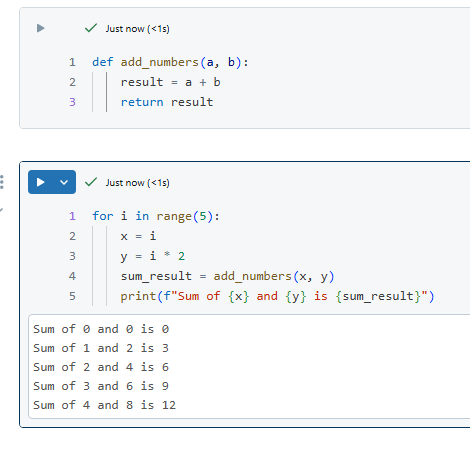
Let’s try another, more interesting debugging, with functions.
This is my code:
#cell 1
def add_numbers(a, b):
    result = a + b
    return result
#cell 2
for i in range(5):
    x = i
    y = i * 2
    sum_result = add_numbers(x, y)
    print(f"Sum of {x} and {y} is {sum_result}")
The first cell holds the function definition, and the second cell uses it. Placing a breakpoint on the second cell in line 4, I can debug this cell code:

And now I have a few options on the debug toolbar
Continue execution – will continue to run the code until the next break


Let’s try to step in and debug the add_numbers function:

As you can see, the cursor moves from the main code (the second cell) to the function (the first cell) and debugs it, and we can see the values of the internal function on the variables sidebar. To move back to the main code, click on step out.
To stop the debugger and get out, we can click on the Stop button.
The debugger console
Another helpful feature is the debug console. You can use it to run short Python code to know more about your variables. Just type in your code and click “enter” (to use multiline code, use shift + enter to move to a new line):

If you are working with dataframes, you can use df.show() in the debugger console to show the dataframe (display will not work here).
More helpful tips
Another two useful coding tips, not necessarily related to debugging:
- To get more space to see your code, you can click on the open focus mode button, located on the top right corner, to focus on the current cell, hiding the other cells. You can also use the keyboard shortcut ctrl+alt+O.
- To format your Python code, use the format option, found on the 3 dots menu on the top right corner of the cell. Keyboard shortcut ctrl+shift+F.
Sources: Microsoft Docs – Azure Databricks Debugger
Happy coding! Let me know in the comments if you have more debugging or coding tips.


1 Response
[…] Chen Hirsh enables a debugger: […]